Analyzing segmented chart design for presidential economic

avatar

ScholER

the world's intellectual hangout

Bobby's profile picture on Select App
Bo

Bobby

路2 hours ago
shared a link post in group #ScholERvia#The Most Important Thing
This segmented chart design is brilliant for cutting through the noise, but does resetting the baseline at zero unfairly penalize presidents who serve during massive economic shocks (like 2008 or 2020)? Where do we draw the line between policy choices and unavoidable crises? I came for the debt analysis and stayed for the chart design. 馃槃 The segmented cumulative line chart is a clever way to preserve context while making comparisons much easier. Great read. #Data is beautiful #ScholER #REAL Truth https://medium.com/data-s..
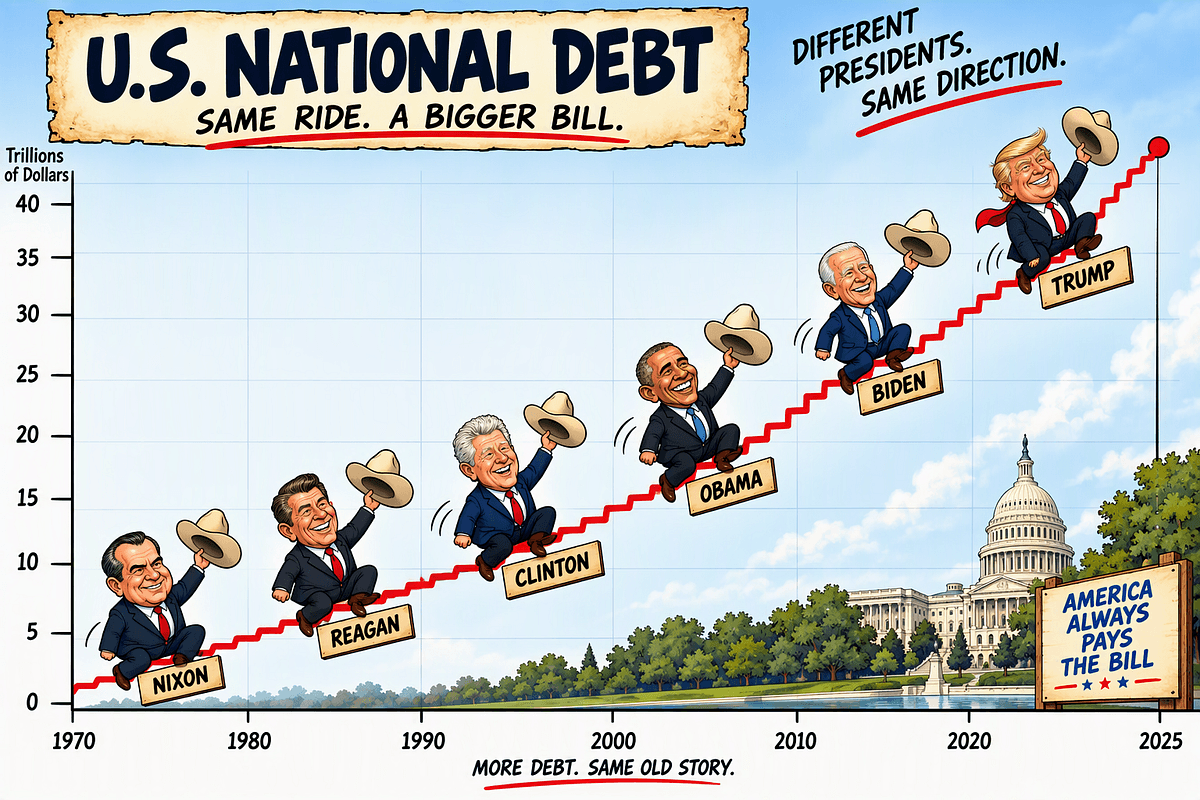
The Best Chart for Comparing Presidents
medium.com

The Best Chart for Comparing Presidents

Meet the segmented cumulative line chart

Comment here to discuss with all recipients or tap a user's profile image to discuss privately.

Embed post to a webpage :
<div data-postid="wkeaqgy" [...] </div>
Powered bySelect路iOS路Android
Privacy|Terms|